Radiologic Technologist and Technician Salary in Minnesota: $88,368 (2026)
Quick Answer:Across Minnesota's 44 metropolitan areas, the average median radiologic technologist and technician pay sits at $88,368/year heading into 2026 — a figure projected from 2025 BLS OEWS wage data for SOC 29-2034. Because Minnesota sits at BEA RPP 98.5 (1% below the U.S. baseline), that statewide median translates to roughly $89,714 in nationally-comparable purchasing power. Highest-paying metros: Minneapolis ($86,510), St. Paul ($85,641), Bloomington ($84,977).
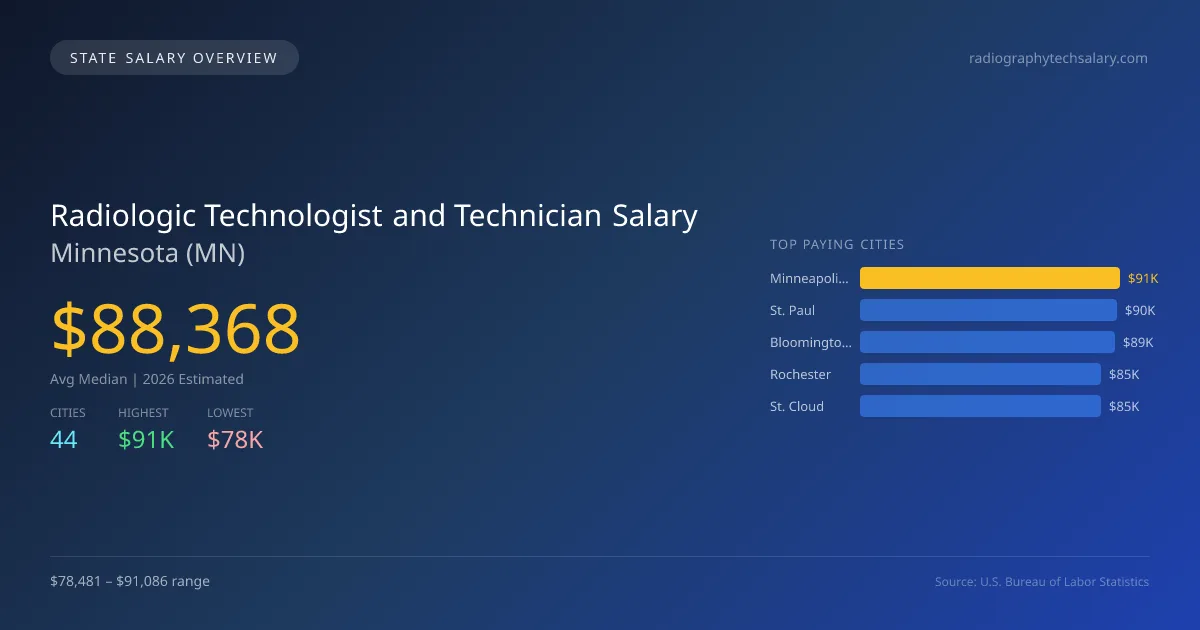
In Minnesota, the average median salary for radiologic technologists and technicians is projected to be $88,368 in 2026, exceeding the national median of $84,348 by 4.8%. Variations in pay across cities are significant, with Minneapolis leading at $91,086, while Faribault presents the lowest at $78,481, creating a salary gap of $12,605. This difference can be attributed to factors such as cost of living, demand for healthcare services, and local market conditions. Minnesota's state licensing requirements ensure that radiologic professionals meet specific educational and training criteria, which directly impacts job qualifications and the scope of practice. The demand for radiologic technologists is driven by the state's growing healthcare industry and an aging population requiring increased medical imaging services. With a projected annual growth rate of 5.29% for employment in this field, the job market outlook remains positive. Major metropolitan areas, such as St. Paul ($90,171) and Bloomington ($89,472), reflect strong opportunities, further contributing to a robust workforce. Overall, Minnesota presents an advantageous environment for those entering or advancing in the radiologic technology profession.
Minnesota Radiologic Technologist and Technician Salary Range
Overall salary range in Minnesota: $54,122 (lowest entry-level) to $139,766 (highest top earner)
Minnesota vs National Average
Minnesota radiologic technologists and technicians earn 4.77% more than the national median (+$4,020/year difference).
Minnesota Radiologic Technologist and Technician Salary Distribution (2026)
Radiologic Technologist and Technician salaries in Minnesota range from $74,021 (entry-level, 10th percentile) to $112,410 (top earners, 90th percentile), with a median of $88,368. The Minnesota median is $4,020 above the US national median of $84,348. The average hourly rate is $42.48/hr. Approximately 4,310 radiologic technologist and technicians are employed across 44 cities.
2019 BLS Actual
$68,081
2025 BLS Actual
$83,928
2026 Current Est.
$88,368
2019–2027 Growth
+36.7%
Salary Trajectory for Radiologic Technologists and Technicians in Minnesota (2019–2027)
2019–2025: actual BLS OEWS data for this metro area. 2026+: CAGR 5.29% projection.
| Year | Annual Salary | Status |
|---|---|---|
| 2019 | $68,081 | Actual |
| 2020 | $69,776 | Actual |
| 2021 | $73,206 | Actual |
| 2022 | $76,597 | Actual |
| 2023 | $78,871 | Actual |
| 2024 | $80,377 | Actual |
| 2025 | $83,928 | Actual |
| 2026(current) | $88,368 | Estimated |
| 2027 | $93,043 | Projected |
Based on 7 years of BLS OEWS data for the Minnesota metropolitan area, the median radiologic technologist and technician salary grew 23.3% from $68,081 (2019) to $83,928 (2025). At a 5.29% compound annual growth rate, salaries are projected to reach $93,043 by 2027 — a total increase of $24,962 (36.67%) from 2019.
Note: Historical values (2019–2025) are actual BLS OEWS figures for the Minnesota metropolitan area, sourced from annual Occupational Employment and Wage Statistics surveys. 2026–2026 figures are current estimates, and 2027 values are projections, calculated using a 5.29% CAGR derived from 7-year BLS historical data. Actual salaries may vary based on employer, experience, certifications, and local market conditions.
Top 5 Highest Paying Cities in Minnesota
Lowest Paying Cities in Minnesota
Best Value Cities for Radiologic Technologists and Technicians in Minnesota
When adjusted for local cost of living, these Minnesota cities offer the most purchasing power for radiologic technologists and technicians.
| City | Nominal Salary | CoL Index | Adjusted Salary |
|---|---|---|---|
| St. Cloud | $84,579 | 87.632 | $96,516 |
| Rochester | $84,579 | 90.821 | $93,127 |
| Duluth | $82,189 | 88.768 | $92,589 |
| St. Paul | $90,171 | 98.5 | $91,544 |
| Bloomington | $89,472 | 98.5 | $90,835 |
Adjusted salary = nominal salary × (100 / CoL index). CoL index: 100 = national average. Lower index = lower cost of living.
Salary by Experience Level in Minnesota
| Experience Level | Estimated Annual |
|---|---|
| Entry Level (0-2 years) | $74,021 |
| Mid Career (3-7 years) | $88,368 |
| Experienced (7+ years) | $112,410 |
Estimates based on BLS percentile data averaged across Minnesota metro areas. Individual pay varies by employer, certifications, and specialization.
All 44 Cities in Minnesota
| # | City | Median Salary |
|---|---|---|
| 1 | Minneapolis | $91,086 |
| 2 | St. Paul | $90,171 |
| 3 | Bloomington | $89,472 |
| 4 | Rochester | $84,579 |
| 5 | St. Cloud | $84,579 |
| 6 | Maple Grove | $84,209 |
| 7 | Woodbury | $84,176 |
| 8 | Eden Prairie | $84,097 |
| 9 | Owatonna | $82,476 |
| 10 | Brooklyn Park | $82,366 |
| 11 | Plymouth | $82,222 |
| 12 | Duluth | $82,189 |
| 13 | Roseville | $82,173 |
| 14 | Chaska | $82,108 |
| 15 | Minnetonka | $82,090 |
| 16 | Cottage Grove | $81,999 |
| 17 | Burnsville | $81,932 |
| 18 | Lakeville | $81,629 |
| 19 | Chanhassen | $81,573 |
| 20 | Inver Grove Heights | $81,444 |
| 21 | Eagan | $81,432 |
| 22 | Brooklyn Center | $81,411 |
| 23 | Elk River | $81,399 |
| 24 | Prior Lake | $81,315 |
| 25 | Ramsey | $81,019 |
| 26 | Blaine | $80,675 |
| 27 | Apple Valley | $80,550 |
| 28 | Shakopee | $80,470 |
| 29 | Coon Rapids | $80,458 |
| 30 | Savage | $80,329 |
| 31 | Edina | $80,320 |
| 32 | Maplewood | $80,084 |
| 33 | Andover | $80,065 |
| 34 | Richfield | $80,026 |
| 35 | St. Louis Park | $80,019 |
| 36 | Moorhead | $79,904 |
| 37 | Mankato | $79,884 |
| 38 | Northfield | $79,325 |
| 39 | Hastings | $79,156 |
| 40 | Fridley | $78,801 |
| 41 | Winona | $78,736 |
| 42 | Shoreview | $78,704 |
| 43 | Austin | $78,581 |
| 44 | Faribault | $78,481 |
More Minnesota Salary Data
Hourly Rates
Explore radiologic technologist and technician hourly pay in Minnesota cities.
Entry Level
Starting salaries for new radiologic technologists and technicians.
Senior / Experienced
Top earner salaries for experienced radiologic technologists and technicians.
Compare Cities in Minnesota
View all comparisons →Explore More Radiologic Technologist and Technician Salary Data
Frequently Asked Questions
How much do radiologic technologists and technicians make in Minnesota in 2026?
What is the highest paying city for radiologic technologists and technicians in Minnesota?
How does Minnesota radiologic technologist and technician pay compare to the national average?
What is the entry-level radiologic technologist and technician salary in Minnesota?
How many radiologic technologists and technicians are employed in Minnesota?
Which Minnesota city offers the best value for radiologic technologists and technicians?
Written by Jordan Lee, RT(R), RT(TM)
Career Analyst
Jordan Lee has over 10 years of experience in radiologic technology. They specialize in mammography and work in an outpatient imaging center.
Methodology & Data Source
Statewide salary figures on this page are 2026 projections based on the Bureau of Labor Statistics Occupational Employment and Wage Statistics (OEWS) survey, May 2026 release. A 5.29% compound annual growth rate (CAGR), derived from 6-year national BLS wage trends, was applied to each metro area's reported salary to estimate current 2026 radiologic technologist and technician compensation across Minnesota. State averages are employment-weighted across 44 metro areas — larger metro areas with more radiologic technologists and technicianscontribute proportionally more to the average, producing figures that better reflect typical compensation. Individual pay varies by city, employer, certifications, and experience.
Data Sources & Methodology
Source: BLS, OEWS, 7-year dataset (–). Per-city data from annual BLS metropolitan area surveys.
2026 figures are projected from 2025 BLS data using a compound annual growth rate (CAGR) of 5.29%, derived from historical BLS wage trends for radiologic technologist and technicians (SOC 29-2034).
Compiled and verified by Jordan Lee, RT(R), RT(TM), a licensed radiologic technologist and technician with 10+ years of clinical experience. · View source data at BLS.gov